


How Can We Help?
Business Data Model
The Business Data Model is a crucial source of management information to answer just about every financial question your client could ever ask. Anything that is not an integral part of one of VFD’s many reports and models, can be found in the Business Data Model. This robust tool provides comprehensive analytical capabilities, empowering users to dive deep into their financial data and uncover actionable insights.
Typical Use
This is most frequently used by whoever is tasked with preparing the ‘Management Information’ each month as part of the workflow cycle. On the rare occasion the information needed is not immediately available, you can take an action to investigate and report, and in next to no time respond with the financial information required.
Whatever the Question, an Answer in Seconds: The Business Data Model gives your team the ability to:
Analyse P&L Trends Over the Past 36 Months
Gain a clear understanding of the business’ financial performance with the enhanced trend analysis tools. By examining Profit and Loss (P&L) statements over the past 36 months, you can identify patterns, assess financial health, and make data-driven decisions. This long-term view helps in spotting trends and anomalies that might otherwise go unnoticed.
Create Your Own Bespoke P&L
Every business is unique, and sometimes also its financial analysis needs. The Business Data Model allows you to create custom P&L statements tailored to your specific requirements. This bespoke feature enables you to focus on the metrics that matter most, providing a personalised view of financial performance over the past 36 months.
Profitability Analysis by Tracking Category
Understanding profitability at a granular level is crucial for business success. With four different views to choose from, you to track profitability by category for clients using Xero. This feature helps you pinpoint the most and least profitable areas of a business, facilitating better strategic planning and resource allocation.
Analyse Balance Sheet Trends Over the Past 36 Months
Balance sheets are fundamental to assessing a company’s financial stability. The Business Data Model provides an in-depth analysis of balance sheet trends over the past 36 months, offering insights into assets, liabilities, and equity changes. This analysis is essential for evaluating a business’ long-term financial position and sustainability.
Create Your Own Bespoke Balance Sheet
As with P&L statements, the Business Data Model allows you to customise your balance sheets. This bespoke feature ensures that you can highlight the specific balance sheet items that are most relevant to your business, giving you a clear picture of your financial health over the past 36 months.
Analyse Revenue Generated by Customer
Revenue analysis is a key aspect of financial management. The Business Data Model enables you to analyse the revenue generated by each customer over the past 36 months. This insight helps you identify your top clients, understand customer behaviour, and tailor your sales and marketing strategies to maximise revenue.
Analyse Revenue by Customer and Product/Service Over the Past 12 Months
For a more detailed revenue analysis, you can examine the revenue generated by each customer for specific products or services over the past 12 months. This level of detail helps you understand product/service performance, customer preferences, and opportunities for upselling or cross-selling.
Invoice Analysis Over the Past 36 Months
Invoices are a rich source of financial data. Our Business Data Model offers comprehensive invoice analysis over the past 36 months, helping you track billing patterns, payment cycles, and customer reliability. This feature is vital for maintaining healthy cash flow and optimising your invoicing processes.
Update Your Forecasts with Actuals
Bridging the gap between forecasts and actual performance is crucial for accurate financial planning. The Business Data Model allows you to update your client’s forecasts with actual data, providing a detailed analysis of performance versus forecast. This comparison helps in refining future forecasts and improves financial accuracy.
Reconciliation
The Business Data Model also provides an important monthly reconciliation from the Net Profit calculated in the accounting software to the EBITDA displayed in VFD Pro’s reports and models.
Conclusion
The Business Data Model is more than just a financial analysis tool; it’s a comprehensive solution designed to enhance your financial analysis. Whether you’re looking to analyse P&L trends, customise financial statements, track profitability, or dive deep into revenue and invoice data, you’re covered. Embrace the power of detailed financial analysis and take your business to new heights with the Business Data Model. You are now able to effortlessly deliver exactly the information your client needs and in a format that best suits their needs in a matter of seconds.
Process Notes:
How To Create a bespoke P&L
Whilst the P&L Trends tab displays 36 months of history based on the Chart of Accounts within your accounting package, you can adjust the presentation to suit specific requirements. Each nominal is assigned to a category and can be grouped with other nominals as required.
- Bespoke P&L Design tab
- List all categories required in column A from row 4 down (do not leave any gaps)
- Assign the order that each category will appear in column B
- You can assign cumulative subtotals as you go by selecting yes in column C
- You can name your subtotal in column D
- P&L Trends tab
- Assign each nominal to a category in the highlighted section in column C
- Bespoke P&L Design tab
- Select whether you would like each nominal displayed in alphabetical or descending value order using the drop down in cell F3
- Click ‘Create Bespoke P&L’
- Bespoke P&L tab
- Your bespoke P&L will be displayed on this tab
How To Create a bespoke Balance Sheet
The Balance Sheet Trends tab displays 36 months of history based on the Chart of Accounts within your accounting package, you can adjust the presentation to suit specific requirements. Each nominal is assigned to a category and can be grouped with other nominals as required.
- Bespoke Balance Sheet Design tab
- List all categories required in column A from row 4 down (do not leave any gaps)
- Assign the order that each category will appear in column B
- You can assign cumulative subtotals as you go by selecting yes in column C
- You can name your subtotal in column D
- Balance Sheet Trends tab
- Assign each nominal to a category in the highlighted section in column C
- Bespoke Balance Sheet Design tab
- Select whether you would like each nominal displayed in alphabetical or descending value order using the drop down in cell F3
- Click ‘Create Bespoke Balance Sheet’
- Bespoke Balance Sheet tab
- Your bespoke P&L will be displayed on this tab
Use Cases
There are numerous use cases for this functionality, including but not limited to:
- Tailoring the reports to align with their industry’s standards or specific preferences can be impressive and help build trust.
- When applying for business loans or lines of credit, financial institutions may request customised P&L and Balance Sheet reports to assess the creditworthiness.
- In M&A transactions, both buyers and sellers may benefit from bespoke financial reports. Sellers can present financial information in a way that highlights the company’s strengths and growth potential, while buyers can request customised reports to assess the target’s financial health and risks effectively.
- Reports can be designed for internal management meetings to align with the company’s internal reporting needs, focusing on key drivers of success.
- Startups and early-stage Companies may find value in custom reports that emphasise growth metrics, burn rate, and other factors critical to investors and stakeholders during the early stages of development.
- Customised reports can help businesses optimise their tax strategies by highlighting deductible expenses, tax credits, and other tax-related details. They can also facilitate tax compliance by presenting financial data in a format preferred by tax authorities.
- Strategic Decision-Making: When making strategic decisions, such as expanding into new markets, launching new products, or changing pricing strategies, custom reports can provide a clear view of the financial implications of these decisions, aiding in risk assessment and scenario analysis.
Example Model
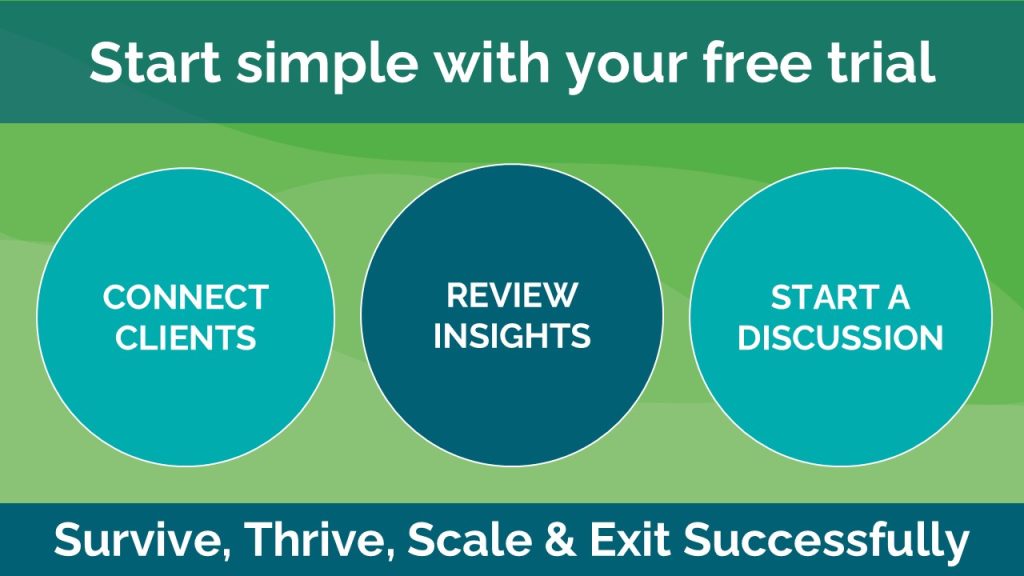
To access the ‘Business Data Model’ please request a free trial of the VFD Pro platform – click here.
The model is available within the ‘Demo Reports’ area of your VFD Pro portal.